Contour lines are lines that describe the height of an area. Contour lines are also found on the RBI map, their function is to describe the height of the area on the map sheet. Contour lines are represented by line symbols. Contour lines also have closed lines, meaning that to describe an area, contour lines do not have an end and a beginning.
Contour lines on maps can also provide slope information. If on a map there are tight contour lines, the area has a steep slope. Meanwhile, if a map contains sparse contour lines, the area has a gentle slope.
Contour lines can be made using field survey methods or scientific means (remote sensing). The field survey method is used to determine the height of an area in detail with a relatively small area coverage. This data is usually used as a reference in development and disaster mitigation, such as flood disaster mitigation, road construction, and building construction. While the scientific method (remote sensing) is used to determine the height of an area with a large area. This data is usually used to determine the distribution of altitude in an area. For contour maps using remote sensing, raw data is needed, such as DEM (Digital Elevation Model) satellite imagery.
How to Create Contours with DEM
Contouring has 2 methods as described above. Contouring with DEM can be done quickly. DEM is a product of radar satellite imagery. DEM satellite images that are often used to create contours are TerraSar (15 meters accuracy), ALOS (10 meters accuracy), SRTM (30 meters accuracy, and DEMNAS (8 meters accuracy but only available in Indonesia). will produce a good contour map as well.
To make this contour map, you need a computer or laptop that has ArcMap installed. Also, specify the area you want to create a contour map for. If you have followed the steps below
Work steps
- Prepare tools and materials to create contours from dem satellite images. Such as laptops/computers, ArcMap applications, DEM satellite images, and regional boundary shapefiles.
- Open the ArcMap application on the laptop/computer you are using.
- Add DEM data to ArcMap main window. You do this by right-clicking "Layer" in the "Table of Content" column, then selecting "add data".
- Locate the DEM file storage location in the computer/laptop directory.
- After appearing in the main ArcMap window, select the ArcToolBox menu. The Arctoolbox menu is in the top menu window.
- In the Arctoolbox window, select Spatial Analyst tool>Surface>Contour. Then a new window will appear, this window is used for setting the contour creation process.
- First column: Select the input raster with the dem data that was entered earlier. The trick is to drag the file name in the "table of content" to the processing window.
- The second column: The location for storing the processed contours. Select the location where you want to save the processed contour shapefile. Make sure the storage directory is not too complicated, as it can affect the creation process.
- Third column: Fill in the contour interval you want to create. The unit of contour interval here uses meters.

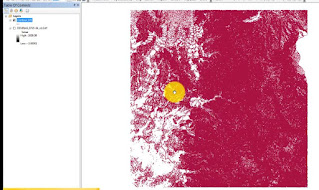
- After all, is filled, click OK. Then the processing will start immediately. Then the result will be like the image below.
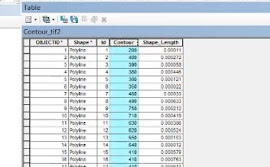
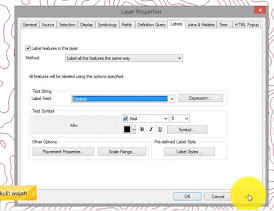
- To display the contour interval in the main window, do the following: right-click the processed contour shapefile>porpertis>click the labels column>check "Label features in this layer">change the label field to "Contour">Click Ok.


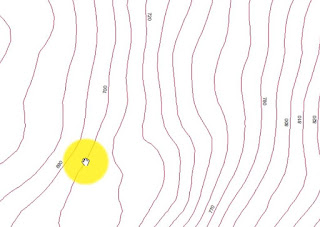
- In the main window, the contour lines will show the height of the contour as shown below
That was the quick way to make contours with DEM. Pretty easy isn't it? The process of making a contour map also does not require a long time. If you found this article helpful, you can share it with your friends or colleagues.


